Growth Metrics To Chase
Growth Metrics To Chase
Data is captured, analyzed and leveraged to assist marketers in growing business

The biggest mining industry currently is not Gold or Platinum, but Data! Data has proliferated manifolds in the last decade, from 1.2 zettabyte (1 ZB = 10^12 GB) data generated in 2010 to 64 ZB in 2020 at a whopping 49% CAGR growth.
In one of the articles, Brian Balfour mentions Data analytics as a key building block for Growth Marketing. It's not about creating the dashboard yourself, but how you can design growth metrics for your business with the analytics team. It’s also about how you read and interpret the data and take actions based on insights.
In this article, I would discuss 4 broad categories of key growth metrics. I would touch upon the definition of each metric, its benchmarks and variations along with insights to draw to give a full rounded picture.
User engagement metrics
Funnel metrics
Retention metrics
Cost and efficiency metrics
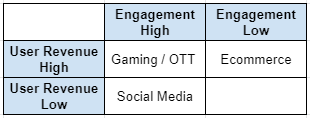
I created a 2X2 matrix based on the level of engagement and revenue generated from users. Based on this, I would highlight the metric applicability and nuances in 3 broad industries viz. Ecommerce, social media and Gaming/ OTT. Gaming and OTT platforms have high user engagement and high revenue and fall under the first quadrant. Healthtech, Edtech and Fintech would fit in the 2nd quadrant along with ecommerce. Short video and content platforms would form the 3rd quadrant along with Social Media.
User Engagement Metrics
DAU is the consumer tech industry and investors’ darling. DAU is daily active users or the unique number of users who performed events like an “App open” or “Website visit” in the 24 hours of that day, where the business or industry will define what an active user means. We can filter out DAU whose sessions last for less than 5 seconds, which are generally due to a mistaken click, to calculate genuine DAU.
Then comes MAU, which is the unique number of users who visited a website or App in any given month. MAU is a stable metric for an established player with a strong use case among its user base. On the other hand, DAU numbers can fluctuate based on day of the week, seasonality, mega events and many more.
DAU/ MAU is a derived metric which reflects the stickiness of the product. The range hovers between 3.3% to 100%, 3.3% meaning every active user uses product exactly once in a month, whereas 100% means every active user uses product every single day of the month. A typical ecommerce platform might see a ratio of ~10-20% and a social media or Gaming/ OTT might be ~50-80%. As most ecommerce platforms have at least one peak day in a month, it's easy to have high DAU/ MAU for peak days, hence it's important to calculate it as Average DAU / MAU to counter variations. If a business has a lower ratio than competition, it means the product isn't sticky among its active users. The business needs to think of additional use cases and corresponding nudges to keep engagement high, else they run a risk of user churn altogether.
User base is the unique set of users who constituted MAU in the last couple of months. Businesses define the time frame based on typical usage frequency. For OTT/ Gaming or Social media, it should be around 1-3 months. For an ecommerce platform it can be between 6-12 months. The users with user IDs but are not part of the user base are considered churned users. Most of the CRM activities are targeted towards the user base with minor focus on churned users (to reactivate them). DAU/ User base is another derived metric, which indicates engagement.
Time spent on App or Web indicates how helpful users find the product. For social media, OTT/ gaming platforms, the higher time directly correlates to better engagement even if it is several hours per day per user. However for an ecommerce product, the time spent beyond a limit is an indication of either the user getting confused or finding it difficult to make a purchase. Similarly, sessions per DAU and Pages per sessions or DAU tell a similar story.
N-Day engagement tracks the user engagement post N days of acquisition.
N-Day Engagement = # users who are active on Nth day after acquisition / # users acquired on given day This highlights one of the biggest problems in Growth marketing, i.e. the biggest drop in engagement comes in the very first week of acquisition. The engagement flattens out after a couple of weeks. Below is a sample engagement curve (also referred as retention curve).

It's important to map the daily engagement curve every month to see general trends and take corrective actions to keep high engagement levels. This day level engagement view is especially useful for gaming/ OTT and social media platforms. If the curve does not flatten out but reaches near 0% after a certain time, it indicates no product-market fit and the engagement is weak.
There are 2 minor variations of the metric. One is Post N day engagement, which is the sum cumulative of all users who engaged N days after acquisition. This number would go up or remain at the same level. The second is Time bound engagement, which is the engagement level between N-day and N+X-day for a period of X days. These 2 are more relevant for ecommerce setup.
Funnel Metrics
Click Through Rate (CTR) is a top of the funnel metric. You measure CTR for both user acquisition and user engagement related CRM activities. It is defined as,
CTR = Number of Clicks / Number of ImpressionsImpression definition varies as per the channel. On SEM, the impression is counted only when the user scrolls till the ad. If the Ad is on the 2nd page of SERP, the impression is not considered served until the user visits the 2nd page. For display campaigns, impression is considered only when at least 50% of the Ad is visible on screen for a minimum of 1 second. For CRM, any push notification (PN) or Email which is delivered is considered an impression. Generally, the marketing agencies have huge influence on these numbers, since most of the infrastructure is maintained by them and marketers need to constantly monitor them.
Most of the clicks would translate to Installs/ signups (Paid marketing) or DAU (in the case of CRM). Any leakage here is the responsibility of the marketer. Few of the reasons for the leakage are incorrect landing page configuration, wrong UTM tagging or OEM level issues in the CRM tool.
Once we reach till DAU in the funnel, the most important funnel metric would be Conversion. This is the single most metric Growth and Product teams work towards through numerous initiatives, customer surveys and A/B experiments.
Conversion = Number of Core Actions Performed / Total DAUFor an ecommerce business the core action can be payment, for a social media platform like Facebook it can be posting, commenting or liking. There are few alternate definitions like Number of Converted users/ Total DAU OR Number of core actions performed/ number of sessions, however, I believe we should consider multiple conversions by a user and not consider sessions as a user generally thinks through purchasing decisions. Conversion formulas can be company specific as well. An ecommerce platform can experience a conversion of ~3-15%, whereas social media, OTT/ Gaming platforms have conversion upwards of 50%.
Conversion depends on a lot of factors like pricing, product availability, acquisition sources, user targeting, engagement activities, search algorithm, content, recommendations, urgency related analytics along with user flows. I would briefly touch upon micro funnel metrics which give a good picture of the user flows. Most basic user flow of an ecommerce platform is as below.

In the above example, we see the biggest drop is from detail page to cart. As the funnel is only 40% efficient, we need to focus on content, ratings & reviews and leverage urgency analytics to help users make the product added to cart and then purchase. Similarly, cart to purchase is 50% efficient and focus should be on pricing, payment options and removing technical glitches. For better home page to listing page efficiency, we have levers like search algorithm, widgets, recommendations and personalization to fit user requirements. For the Listing to detail page, we focus on filters, product availability and ranking algorithm to show better converting products. This constant pursuit of perfection would optimize user flows to the maximum, thereby improving conversion.
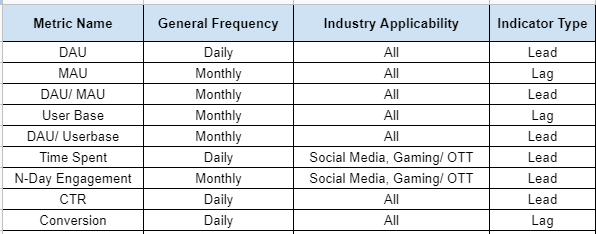
I will cover Retention metrics and Cost & efficiency metrics in the Part 2 article. To summarize Part 1, below is the table with few details.