Growth Metrics to Chase - Part 2(Final)
On Retention Metrics and Cost & Efficiency Metrics

In Part 1, I discussed the importance of defining and tracking growth marketing metrics and went on to throw light on User Engagement and Funnel metrics. I also explained benchmarks across industries and major pitfalls while reading or extracting insights from the metrics. In Part 2, I will discuss Retention and Cost & Efficiency metrics in the same format.
Retention Metrics
Retention metrics are primarily from the ecommerce or gaming/ OTT stand point, where purchase or subscription is the core action. I would first touch upon M-X Retention.
M-X Retention is defined as % users who make a purchase again in Xth month after making their first purchase in M0 month. Here is the formula for M1 retention, which is most focused on.
M1 Retention = # users who purchased again in M1 / # users who did first purchase in M0
Retention can be tracked at month level like M1, M2, M3 or at quarter level like Q1, Q2 etc based on industry’s usecase frequency. Gaming industry may track it at a monthly level whereas Ecommerce may choose to track it at a quarterly level. M-X Retention is a range bound metric, for example, M2 retention is calculated based on purchases made between Day 31 to Day 60 from the time of first purchase. Below is how monthly retention might look like for the gaming industry as of 5th July 2021.
M1 Retention = # users who purchased again in M1 / # users who did first purchase in M0 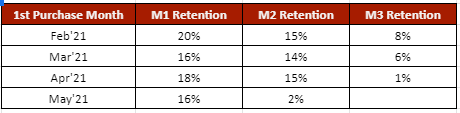
In this scenario, March user cohort retention numbers are poorer than February cohort on M1, M2 as well as M3 retention. March cohort needs to be deep dived by acquisition channels, promotions, conversion funnels to take corrective actions. April cohort’s M1 and M2 retention are better than March’s, however M3 retention is only 1%. This is because July month has just started and the retention number only matures by July end. Same holds true for May M2 retention, which is just at 2% compared to 15% average.
Lifetime Value is the average revenue generated by a user over the lifetime of the product.
LTV = Revenue generated by the users over a lifetime / # of usersAs lifetime revenue can only be estimated, there are multiple formulas to approximate the same. One of them is by calculating revenue for 1 year and then factoring in yearly retention of the users.
LTV = Average Revenue per user per year / ( 1- Year 1 Retention Rate)
In the above example, I calculated the LTV of two acquisition channels. The ARPU (Average Revenue Per User) per year of performance marketing and referral channels are $100 and $120 respectively, so we would assume that LTV of referral would be higher. However, when you check the retention rates and calculate the LTV you would find Performance marketing’s LTV of $167, slightly higher than Referral at $160, owing to better retention.
The best way to calculate LTV accurately is by data modeling with a few years of ARPU, Retention rates and other output metrics. Due to various LTV calculation methods, it would be prudent to understand the formula completely before drawing insights.
LTV/ CAC is an efficiency metric (more on CAC in next section), which indicates whether a marketing channel or overall business can ever be profitable. This metric would provide you an early indication on the profitability and give a chance to relook at a viable acquisition strategy. A healthy business would have 10+ LTV/ CAC so even if we look at LTV at EBIDTA level/ CAC, it would still be 1+, indicating profitability.
Cost and Efficiency Metrics
CAC or Customer Acquisition Cost, is the most fancied metric to measure marketing efficiency. It is defined as the average overall cost per new user who performed a core action on the platform for the first time.
CAC = (Total Marketing Cost + Total Discounting Cost) / Total users who performed core action for the first timeThe users could have been acquired in previous months as well, but since they performed the core action in the current month, they would be a part of this month’s CAC calculation. Hence, CAC is a directional number, which at times takes credit for previous months’ efforts. However, since there would always be spillage in terms of certain % of users who are acquired in any given month, would perform core action in the future months, the CAC numbers stabilize over time. CAC number within a month always improves as month goes by, since there is a lag between user acquisition and user performing core action.
The overall blended CAC should ideally exclude new users acquired organically without any marketing effort, especially for an established firm. If organic new users are included in the formula, blended CAC would go down significantly and look great to investors/ leadership. Generally, marketers track CAC for every channel or sub channel as well, like Performance Marketing CAC, Referral CAC or SEM CAC.
CAC/ AOV is an ecommerce and OTT specific metric, which measures CAC as a % of the average order value (AOV). Lower the CAC/ AOV ratio, the better marketing efficiency we achieve with an ideal range of 0 to 1. Anything more than 1 should be overcompensated with the high retention rates primarily driven by the business model. CAC/ AOV is especially helpful in organizations with multi-country operations, as CAC varies a lot between developed and developing markets.
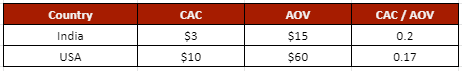
In the above instance, at first it might look like the Indian marketing is optimized with just $3 CAC compared to $10 in the USA. However, when you compare CAC/ AOV, we realize the USA has better marketing efficiency with the ratio at 0.17 vs 0.20 for India.
ROAS or ROI is the Return on Ad Spend. It is also an ecommerce or OTT/ gaming metric, which is measured at a month level for ad or campaign efficiency. Since users don't make a transaction or generate revenue immediately upon signup or install event, we keep a timeline of 30 days for Return calculation. So, to see the final number for June ROAS, we will have to wait till 30th July, as revenue from users acquired on 30th June would mature by 30th July as per the 30 day window. 30 Day ROAS is calculated as total average revenue generated in the first 30 days by users who sign up per every dollar spent to acquire these users.
30 Day ROAS = 30 Days Revenue from new installed or signed up users / (Total Marketing Cost + Total Discounting Cost) You may shorten the window to count revenue based on business model and historic trend. If you are in a business or serve a frequent usecase, where the time duration between install to the first transaction is no more than 14 days, then you can consider shortening 14 days ROAS or 7 Day ROAS as well.
As all the Spiderman movies suggest, with great power comes great responsibility. The power to read the data and metrics can be misutilized to misguide leadership (not for long!) by telling only the story of better looking numbers or can be utilized properly in guiding the team ship in the right direction!
Happy reading! If you like my articles and want to read them without a miss, please subscribe to my channel.